Chart to Chart
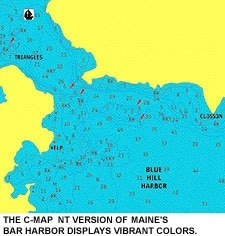
Chart to Chart
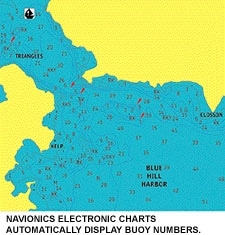
Chart to Chart
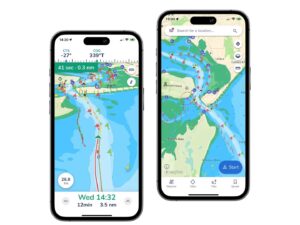
Imagine yourself cruising in waters you’re not familiar with. What do you do? Pull out your trusty charts and start navigating. Because paper charts are so cumbersome, many boaters have come to rely on electronic versions. But which is the most trustworthy? Which will tell you at a glance exactly where you are and where you should go next? Well, as usual, it’s BOATING to the rescue.
Aboard the Crown Pilot, a 36′ Hatteras convertible at Landings Marina in Rockland, Maine, we installed two Furuno chartplotters, each loaded with electronic charting software – from C-Map (508/477-8010, www.c-map.com) and Navionics (800/848-5896, www.navionics.com). Then we asked for opinions, which werewhich were freely given by Bob Bernstein, the Crown Pilot‘s captain; Skip Strong, pilot of the Russian tall ship Mir; Rob Spear and Jeff Cockburn, two Penobscot Bay commercial pilots; and various other first mates and professionals who cared to chime in. These are people who rely on charts for their livelihoods. Their opinions matter.
First, a bit of history. A test such as this would have been impossible a couple of years ago because there wasn’t a plotter that would accept both C-Map NT and Navionics charts. Furuno changed all that when it came out with its GP-1850DF plotter. When buying electronic charts, you face two choices: raster or vector. Both are electronic representations of the paper charts boat owners have been buying for years, but vector charts give you more viewing options. They store information in digitized layers in a single database, allowing you to add or delete layers as you need to view them. Some fields of information include depth contour lines under 10 fathoms, soundings, aids to navigation, place names, and so forth.
Both the C-Map and Navionics software used for this test are vector charts formatted for Maine’s Penobscot Bay, and each uses a mixture of green, yellow, blue, white, and red to distinguish its features.
Readability
A major consideration with any electronic chart is readability: How quickly can you use the display to tell where you are? Once we turn on the machines, it’s apparent that C-Map uses its colors more effectively. Strong quickly notes the color benefit: “C-Map’s separation of colors is much easier to deal with.” This becomes most apparent near shore, where the colors used for land, docks, anchorage areas, water, and channels are nicely differentiated, making it easy to tell where the boat is in relation to a channel, navaid, or point of land. “The color scheme is much easier on the eye,” agrees Bernstein. Navionics didn’t use as many colors simultaneously, and they lack the strong tonal contrasts of C-Map’s colors.
C-Map also clearly displays cans, nuns, and bell buoys – their onscreen shapes resemble their real-life counterparts. Navionics, on the other hand, differentiates each symbol by color display, but they all resemble the symbol for a lighted navaid. Looking from the C-Map screen to the Navionics screen, Spear says of the C-Map display, “It’s apparent where you are. You need to get used to the Navionics screen.” Part of the confusion, he says, was that the teardrop shape used to identify the Navionics buoys is the same symbol that would be used for a fixed light. He also wonders why both chart companies couldn’t stick with the symbols used on the traditional paper chart.
Blame it on age or the need for bifocals, but many of these guys don’t like the size of the symbols on the Navionics screen. They find themselves literally leaning in closer to see what lies ahead. C-Map compensates for this with larger icons. Relying on color, as you must with Navionics, to determine what the object is you’re coming up to, doesn’t always fill the bill. When you’re looking at an approaching aid to navigation through the wheelhouse window, “the sun can be positioned so that it’s impossible to tell the color of what you’re looking at, but you can tell its shape,” says Bernstein. “And at night, you often don’t know the color, but you can make out the shape of an aid to navigation.” That makes it easier to match that shape with a similar one on the C-Map screen.
A plus for Navionics is its automatic display of buoy numbers; C-Map has to be set up by the user to show this information. “It’s a nuisance to chase that down,” says Spear. Navionics identifies buoys and anchorage areas that aren’t identified at first glance on the C-Map display. In either case, with C-Map or Navionics, if you’re in doubt about what aid to navigation you’re approaching, put the cursor on the object and it will be identified in an information window at the top of the screen.
C-Map has some color problems, too. The dumping-ground buoy is the wrong color, and the sector circles for the navigation lights, which are yellow on the C-Map display, should be white (which is the color you would see at night). Again, you can put the cursor on the dumping-ground buoy and the information window at the top of the screen provides a description. It’s just that it takes more time and manipulation to get the information that way, when you should be able to tell just by looking at the screen.
Accuracy
When there’s limited visibility, and there are shipping lanes nearby, you don’t want to find yourself compressed under the bow of a freighter or tanker. Thus, it’s a good idea to know exactly where you are in relation to those lanes. On the C-Map chart, shipping lanes show up as two parallel lines with dots between them on the four-mile scale. At the same scale, the shipping lanes on the Navionics chart use two parallel red lines to show their location. The effect at that scale is that you can see and find things more readily on the C-Map chart if your attention is divided.
Switch to other scales on C-Map, however, and the shipping lane is marked only by a single line that represents the middle of the lane. This gives the advantage to Navionics, explains Bernstein, who favors the two-mile scale when following a tanker out of the bay. “I use the Navionics chart to do my approach to a ship because I get the double line on the traffic lane, which is more useful to me. That’s because before I make my approach I want to keep to the edge of the traffic lane because the ship is in the center of the lane.”
Identification
Although there are some times when C-Map doesn’t display the same data found on a Navionics chart for Penobscot Bay, overall, C-Map shows far more data than Navionics. That’s true for the names of islands and mainland locations as well as for potential navigational hazards. For instance, the Rockland breakwater is identified on C-Map, but you have to put the cursor on the breakwater shown on the Navionics display to have it identified. C-Map also has far more depth markings than Navionics. On one level, all of C-Map’s information is helpful, showing the identity of various islands, coves, and harbors, but at the same time, it can be confusing because a lot of information, displayed in a number of different colors, gets jammed onto a small screen. In addition, the C-Map chart of Penobscot Bay left out information in a couple of places where the electronic chart was built from two differently scaled government charts that abut each other, and the digitizing process used to make up the electronic charts didn’t compensate for the change in scale ranges. The information for the area that’s blank on one scale can be obtained by zooming to another C-Map scale. Navionics provides enough information to be usable without having to zoom in or out.
For instance, in the Fox Island Thoroughfare, the passage between North Haven and Vinalhaven Islands, using the four-mile scale, C-Map shows a blank area without depth marks or contour lines. At the same scale, Navionics shows some depth marks, contour lines, and has a buoy you can set a course to. To get navigating information on the C-Map chart, you have to zoom down to two miles. Some people may find shooting courses by way of the cursor easier on the Navionics chart because they won’t have to zoom in to find their next waypoint.
Adjustments
Though C-Map’s richness in detail can get in the way, any confusion can be avoided by taking advantage of vector charting. To customize the data you want to see and add or delete layers of information, go to the menu, find the appropriate file, and then remove from the screen enough information to make the display less confusing or add information when needed.
Both the C-Map and Navionics menus are easy to use and about equally fast at accessing information. If you want to remove all depth markings other than those less than 10 meters, for example, go to the menu, call up the contour line file, and turn off all depths except ones less than 10 meters. The same can be done for other types of information displayed on the chart, such as text, sectors, or background colors.
C-Map and Navionics operate at about the same speed when working among menu pages, but C-Map is much slower than Navionics when going from one scale level to another. It might be because there’s more information to process, but C-Map often takes six to eight seconds to do a screen redraw when going from one level to another; Navionics does it in about a second. Because the Navionics screen changes so quickly, it’s easy to miss the scale level as it flashes on the screen. One point of contention here: Everyone thinks the scale level should be displayed onscreen at all times on both programs.
Extras
Both C-Map and Navionics have port service information directories, which list the various services available at harbors in the area, such as gas, diesel, ice, and water. An icon appears for each service. Put the cursor on the icon, hit enter, and you’re shown what’s available and where. We tested this for Rockland, and C-Map’s listings were more extensive. In one case, Navionics didn’t list a major marina.
**Price and Updating
**
Depending on how much area you want your electronic chart cartridge to cover determines how much you’ll pay for charts from either company. Both C-Map and Navionics offer three levels of coverage. Each level nearly doubles the amount of coverage as the previous level. C-Map’s prices run $99, $199, and $349. Navionics is priced at $99, $199, and $299. To update a Navionics chart, you’ll get 75 percent off the sticker price if the chart coverage doesn’t change. Otherwise it’s a 50 percent discount. C-Map NT charts can be updated and the older CF85 can be updated to C-Map NT. C-Map says that the pricing varies but it’s less than the original purchase price. You’ll be notified of C-Map updates if you register when you buy a cartridge.
**The Winner
**
So, which is the better electronic chart? After a poll taken among our group, C-Map gets the thumbs up – and this from Penobscot Bay’s professional seamen who are used to dealing with electronic equipment and navigation problems. C-Map charts provide more information and the color contrasts make it easier to tell what you are looking at, despite its slow redraw time.
At the same time, Navionics might be just the thing for the boater who doesn’t feel comfortable fiddling around with electronic equipment. For that buyer, the fewer adjustments required the better. And if he cruises one area often, he’ll quickly get used to the Navionics cartography and how it corresponds to his area.