NOAA is Sinking

NOAA is Sinking
NOAA is Sinking
NOAA is Sinking
NOAA is Sinking
Captain Sam DeBow is a straight shooter. As Chief of the National Oceanic and Atmospheric Administration’s (NOAA) Hydrographic Survey Division, he heads up the branch that collects data for our nation’s charts. When I ask him why boaters are having trouble getting accurate information, he comes right to the point. “We’re completely ignoring the interests of the recreational boater,” DeBow says with characteristic frankness. “Because NOAA is in a crisis.”
How big is the problem? Try the entire coast of the continental United States, Alaska, and Hawaii – from inland bays and rivers to the continental shelf’s edge about 200 miles out. This massive 3.2-million-square-mile chunk of the planet is represented by more than 1,000 charts. It’s the dry land equivalent of trying to represent every inch of the United States and Mexico. But NOAA’s Hydro Division is working with a budget more suitable for making highway maps of Rhode Island.
THE B LIST
The situation is grave. Fifty percent of the data on NOAA charts is more than 60 years old, collected before sonar was commonly available. That means many soundings were made by guys with big forearms dropping lead lines and positions were fixed by sextant. There’s a lot of catch-up work to be done. But given the size and complexity of this task – not to mention the tiny budget – NOAA is forced to choose its charting priorities carefully. Topping the list are the nation’s most heavily trafficked commercial ports; at the bottom are the areas that are important to recreational boaters.
You can’t argue with the logic. Since 1950, the average size of commercial vessels has doubled, and seagoing commerce has tripled. Modern tankers are deeper than ever. Every extra inch of draft on a tanker can mean thousands of gallons of oil and millions of dollars. It can also mean an environmental catastrophe if the tanker strikes an uncharted obstruction. No one wants another Exxon Valdez disaster, least of all NOAA.
NOAA has a shortlist of 40 river entrances and harbors slated for resurveying (visit chartmaker.ncd.noaa.gov for a current list). That’s 43,000 square miles of coastline, about equal to the landmass of Florida. Since 1993, NOAA has managed to resurvey only 9,000 square miles of this. At current funding levels, it will take the organization another 25 years to finish the job. Even then, NOAA will have resurveyed a mere 1.3 percent of its total responsibility. So chances are the charts used by recreational boaters won’t be completely resurveyed in your lifetime – or your kids’.
A CHART IS BORN
Although each U.S. chart must carry NOAA’s stamp of approval, less than half the data on those charts actually comes from NOAA’s Hydro Division. The rest comes from the U.S. Coast Guard and the Army Corp of Engineers, agencies responsible for aids to navigation and maintaining shipping channels, respectively.
NOAA’s job is to collect data about what’s on the bottom, a task it does better than anyone else in the world. It’s so good that the U.S. Navy, even with the immense resources it has at its disposal, relies on NOAA research vessels for sensitive recovery operations, such as gathering the remains of TWA Flight 800 off Long Island in 1996. And that’s the heartbreaker. These guys are so good, yet their hands are tied. Or, more accurately, held out begging for money.
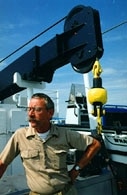
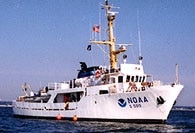
To see firsthand how data is collected, I signed on to NOAA’s 90′ Rude (pronounced Rudy). You may have seen Rude on TV in 1999, when the Navy asked for help to find John F. Kennedy Jr.’s plane off Martha’s Vineyard. For the crew, it wasn’t much of a challenge. Their job is to scan the seabed 24 hours a day, nine months of the year. No one does it better.
I’m picked up by a Boston Whaler jammed with electronics that motors me out to Rude while it’s running survey lines across the approaches to New Haven Harbor in Connecticut. Except for the blue “NOAA” stenciled on its side, Rude is a plain workhorse, the smallest and oldest hydrographic research vessel in the shrinking NOAA fleet.
The crew of 11 officers and scientists has just finished a survey off Montauk Point, which took three months and required more than 220 million soundings over a 25-square-mile stretch of ocean. Most of that data is still onboard when I arrive, stored in dozens of hard drives and cardboard boxes.
There are two ways charts are created. The first is issuing a completely new chart with a resurvey of the area, a rarity nowadays. More common is accumulating changes supplied by NOAA, the Coast Guard, the Army Corp of Engineers, and even commercial fishermen who note significant discrepancies between charted features and actual positions. When at least 200 changes are reported, a revised chart is issued for that area. Rude was in New Haven for a full-blown resurvey of the port and its approaches.
Parts of this harbor haven’t been surveyed since the 1870s. So it’s Lieutenant Commander James Verlaque and his crew’s job to drag a virtual fine-toothed comb over the bottom in an effort to bring charts into the 21st century. Lurking in the back of Verlaque’s mind is the hair’s breadth clearance for the 45′-deep tankers navigating these channels. In some places the only thing between millions of gallons of oil and hull-piercing rocks is three to four feet of brine. This is a man who takes his job seriously.
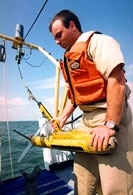
Today, Rude‘s mission is fairly routine. It’s running a line of soundings in one direction across the harbor, turning within 200 meters, and coming back the other way. It’s like mowing the lawn, except the blade is made of sound waves generated by sonar. When dangerous obstructions are located, especially in a channel, Rude will make two or three passes. To be certain NOAA has the data right, Lieutenant James Crocker, the onboard diver, may be sent down to determine an obstruction’s exact depth and shape. During a typical operation, he may dive on 25 different features.
THE BAD OLD DAYS
Twenty years ago collecting accurate data about the ocean floor was a hit-or-miss undertaking. Single-beam or vertical echosounders were fine for recording depths immediately beneath the transducer. But complete coverage was impossible. When a survey ship turned around to run a line in the opposite direction, there could be 100 meters between the first line and the second. Whatever portion of the bottom that fell in between those lines was left blank and later filled in with educated guesses. Thankfully, we now have side-scanning and multibeam sounders that generate 100 percent bottom coverage, fanning out 75 meters to both sides of the ship. Before GPS came along, fixing the exact location of submerged features and soundings were accomplished with sextants and microwave equipment that was highly prone to interference from weather. Ten or more years before that, collecting data usually involved teams of men crammed in a small launch, shouting out numbers and manually recording them on paper.
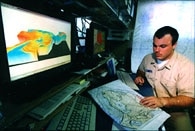
Compared to the old days, Rude‘s tiny data acquisition office might as well be the bridge of the Starship Enterprise. All data is displayed in real time on computer monitors and paper logs, which are examined in further detail in the survey office on the deck below. When Rude passes over a charted obstruction, the location is recorded and discrepancies are noted for changes that will be reflected on the new version of the chart. Verlaque spread out the current New Haven chart and put his finger on a submerged wreck near a breakwater. “We found this 300 meters south of its indicated location,” he notes. “Looks like it was last surveyed in 1990. Probably shifted during a storm.” The next day, Rude discovers two new wrecks. Given the grayscale image on the side-scan sounder, one was likely a barge more than 120′ long. The other was probably a sailboat. Rude immediately informs the Coast Guard, which includes the wreck’s locations in its Local Notice to Mariners. The new chart won’t be printed for another six months, so mariners have to sharpen their pencils and make the changes themselves to the old chart.
Although issuing completely new charts is rare, NOAA never stops trying to keep up with the times. It maintains a “living database” of all raster charts and is working with the Coast Guard and the international maritime community to develop a system that integrates chart data, GPS, and real-time environmental information. Called the Electronic Chart Display and Information System (ECDIS), it’s a breakthrough concept. However, ECDIS will require a wholesale resurveying of the coastline using modern equipment. And NOAA doesn’t have the resources or budget to do it.
By NOAA’s own estimate, thousands of unsurveyed wrecks and obstructions go missing from our charts. New surveys resolve only a small number each year. It’s easy to see why NOAA has quickly fallen behind.
SINKING FUND
In the 1970s NOAA operated 11 ships. Now it’s down to 3, including Rude. Furthermore, NOAA used to survey the bottom right up to the “zero-foot curve” – the shore. But commercial vessels don’t get that close to land, so – much to the detriment of boaters – the curve has been moved back to 18 feet. To compound this bleak picture, a bill passed in Congress, carrying the ironic title Hydrographic Services Improvement Act of 1998, has frozen NOAA’s spending on new equipment. That means Rude won’t be allowed to replace its 20-year-old side-scan sonar or make any other needed improvements. Then Congress rubbed salt in the wound by allocating more funds to private contractors than to NOAA for data acquisition. Last year the Hydro Division only received $12.5 million; $18.9 million went to private contractors.
Anyone who claims that private companies are more cost effective than the government needs to take a closer look at what’s going on. In 1999 NOAA surveyed approximately 1,100 square nautical miles, compared to the 550 miles completed by private contractors who cost taxpayers 50 percent more yet did half the work. Granted, there’s a steep learning curve to the kind of intense hydrographic research NOAA performs. Many private contractors come from the geophysical world, where examining the ocean floor for broad trends, not specific features, is better suited to finding oil reserves than wrecks. Captain DeBow, and anyone else I talked to, wouldn’t say anything negative about this trend toward privatization. After all, they have to work hand in hand with external contractors to accomplish a tough and sensitive job that directly affects the livelihood and safety of millions of people.
When Thomas Jefferson established the Coast Survey in 1807, he understood the critical importance of creating and maintaining accurate charts of our nation’s coastline. Almost 200 years later we seem to be heading in the opposite direction. NOAA is nearly grounded from lack of funds, and the government seems content to let it founder. We are in a revolutionary moment in the history of cartography, with digital technologies making progress by leaps and bounds. If the dedication, care, and professionalism I observed aboard Rude are any indication of NOAA’s capabilities to set the standard for marine charting in the future, then turning NOAA into a rubber stamp bureaucracy is a troubling idea.
“Boaters are the silent majority,” Captain DeBow concludes. “It’s going to take money not only to redress the chart backlog to ensure safe navigation for commercial vessels but also to print new charts from the existing data sitting in NOAA’s databases. It’s a real crisis.”